


JESEI

teacher’s notes
student’s notes


sequence of climatic events – the records overlap in time where the climatic patterns they record match up.
This allows dendroclimatologists to push back the year-toyear record of climatic conditions to long
before the start of instrumental recordkeeping.
Apparatus and materials
Pencil
3 paper strips representing cores taken from trees (see Figure 1 and Figure 1 in the students’ material)
Pupil worksheets
Scissors
Ruler
Sticky tape
Coloured pencil
Cut cross-section of tree (ask local forest ranger) or a tree stump outside
Tree rings: a climate record of the past
(teachers’ notes)
Level
This activity provides an example of one technique that scientists use to study the
way the Earth’s climate has changed over time.
It works most effectively for 14-16 year-olds but with a little simplification, or
shortening, can work well with 12 and 13 year-olds too.
Topic
Tree growth can be affected by climatic cycles and seasonal cycles. The width of
a tree ring shows the amount of growth that has taken place during one year and
thus indicates the growing conditions for that year. When the conditions are good the
tree grows faster and so lays down more tissue in the year, resulting in a wider
growth ring. Poor conditions mean slower growth, less tissue laid down and
consequently a narrower ring.
Description
In this activity students learn about how tree rings provide a record of past growing
conditions and, by inference, climate. They use this principle to work out how cores
from three different trees (three strips of paper marked with stripes to represent rings)
fit together to represent a longer period of time and then use this composite record to
plot a graph of changing growing conditions / climate.
Context
Students doing this activity should already be familiar with the processes of
photosynthesis and the conditions necessary for plant growth. They might have
carried out experiments on factors affecting the rate of photosynthesis / growth in
previous lessons (eg the concentration of carbon dioxide, temperature, light
availability). Most students will have seen the sawn-off end of a tree trunk and
attempted to work out the tree’s age by counting the rings. But tree rings tell us much
more than the age of individual trees. They provide a year-by-year record of
changing climate that can be extended back over centuries, reaching back beyond
the beginning of the historical climatic record. This makes them valuable tools (along
with other proxy records of past climate) for identifying whether current trends in
climatic change are within the natural, pre-industrial, range of climate variability or
outside it, and for dating past climatic changes very precisely.
Teaching points
Tree rings form because during each growth season new water and food conducting
cells (tracheids) are added around the perimeter of the tree trunk. Cells in the spring
growth tend to be larger with thinner walls than the previous set of cells produced at
the end of the previous summer. Over the course of the growing season, successive
rings of cells become smaller with increasingly thick walls. In winter, growth ceases
and no new cells are laid down. Then when the new growing season begins, thin-
walled large cells form again producing a clear line between the old wood and the
new wood because of the difference in texture.
Tree rings provide a record of past climate because their width is determined by tree
growth rate, which in turn is determined by environmental conditions. Since one ring
is produced every year (usually) the ages of the climatic events can be worked out
very precisely by counting back. Records from young trees, old trees, house and ship
timbers and fossil trees can be tied together by identifying sections with the same
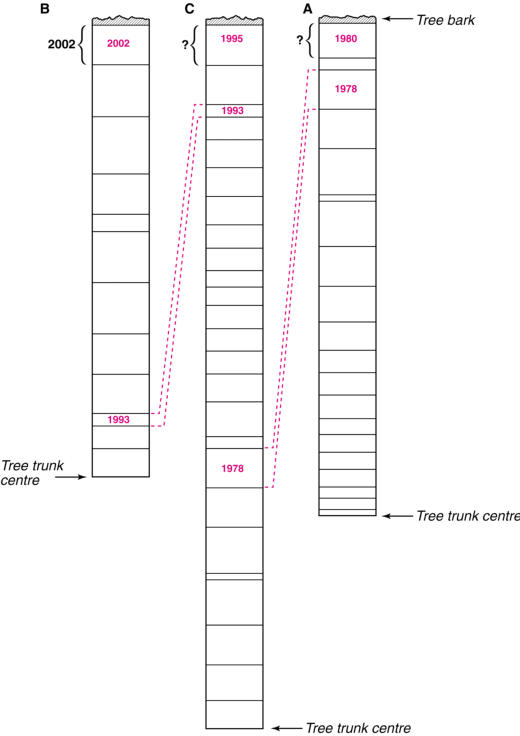
Figure 1 Simulated tree cores
Activity
Introduction
Hold up (or project on to wall) a picture of an old tree: this tree could preserve a
hundred years (possibly more) of climatic history.


Ask students what affects the growth of a tree during a growing season. Here revise
factors affecting photosynthesis ie temperature, light, carbon dioxide concentration,
water availability.
Consider the growth rings on the tree cross-section, picture or stump outside. Ask
students how they think they form, what they represent, what they might be useful for
etc.
Explain that scientists (dendroclimatologists) can get a sample of the tree’s growth
rings by drilling a borehole into the tree (right to the middle) and extracting a core.
You could demonstrate the principle with an apple or a potato and a corer.
Main activity
This section gives the students the opportunity to sample the techniques involved in
reconstructing climatic history from tree rings.
Students work in groups using the pupil worksheet. The teacher should talk them
through it first.
Students are given a set of three prepared strips of paper – they represent cores
taken from three different trees (a living tree sampled in 2002, a fallen tree and a tree
used to build a log cabin) from the same woodland. Show how each rod or strip of
paper represents a core of wood taken from a tree trunk with one end representing
the centre of the tree and the other representing the bark on the outside. The
youngest wood is under the bark.
Using the simulated core samples, students can work out the age of each tree when
the core was taken (in the latter two cases, when the tree died) and record them in a
table like Table 1.
Tree sample Number of rings (= age in years)
A 20
B 12
C 25
Table 1 The ages of different trees
By looking at the ring patterns of the simulated cores, students can line up all three
samples to find how much time all three tree samples span together. They could
colour the overlapping sections so that they don’t lose track. The core samples were
taken from trees whose ages ‘overlap’. Given that the trees are of the same species
and all grew under similar conditions the tree-rings will therefore be the same
distance apart in the same year. With this information it is possible to match up the
rings as shown in red in Figure 1 and count the rings to give the two ‘unknown’
growth-years. The diagrams for each sample can be cut out and laid side by side to
see this more clearly.
Pupils should then measure the width of each tree ring, for each core sample, and
record them in a table such as Table 2. (Grey indicates sections where two strips
overlap.) There is no need to record the overlapping sections twice. Plot the ring-
width data (on the y-axis) against time (on the x-axis). They should plot 2002 on the
left (conventional for palaeoclimatic data). This will give a graph like Figure 2.


Tree ring width
0
5
10
15
20
25

Year


Figure 2 Graph of tree ring width against year
Year
Tree ring width / mm
2
0
0
2
14
2
0
0
1
18
2
0
0
0
20
1
9
9
9
14
1
9
9
8
6
1
9
9
7
18
1
9
9
6
18
1
9
9
5
14
1
9
9
4
14
1
9
9
3
4
1
9
9
2
8
1
9
9
1
10
1
9
9
0
10
1
9
8
9
10
1
9
8
8
8
1
9
8
7
8
1
9
8
6
6
1
9
8
5
6
1
9
8
4
8
1
9
8
3
8
1
9
8
2
8
1
9
8
1
10
1
9
8
0
12
1
9
7
9
4
1
9
7
8
14
1
9
7
7
14
1
9
7
6
16
1
9
7
5
2
1
9
7
4
16
1
9
7
3
14
1
9
7
2
12
1
9
7
1
10
1
9
7
0
8
1
9
6
9
8
1
9
6
8
8
1
9
6
7
6
1
9
6
6
6
1
9
6
5
6
1
9
6
4
6
1
9
6
3
4
1
9
6
2
4
1
9
6
1
2
Table 2 The widths of tree rings
Then they should consider these questions:
Q 1. Compare the ring for the year you were born with the ring for 2002. How do
they compare? Note down any similarities or differences. What might have
caused these?
Q 2. What does your graph of tree-ring width against time represent? = Growing
conditions: wider rings represent better growing conditions, ie warmer and
wetter. Narrower rings represent worse growing conditions, ie cooler and
drier. Hence, it provides a broad record of climatic conditions between 2002
and 1961.
Q 3. Give a brief and general description of how the climate changed during the
period that your tree samples represent.
Q 4. How could we obtain climatic information further back in time than tree rings
provide? = Ice cores can give climatic information back to over thousands of
years, sediment cores from the ocean bed can give climatic information over
millions of years, rocks give climatic information spanning hundreds of
millions of years.
Q 5. If carbon dioxide levels are rising and global warming continues, what
differences would you expect to see in the tree rings between the modern
ones and those laid down in 100 years time? = Future rings would be wider.
Conclusion
As a class, consider other factors that may have influenced growth. For example
fires, pollution, erosion, landslides. Also consider some of the problems with
matching up samples from different trees: certain factors influencing tree growth may
be very local in effect. A landslide or erosion for example might only affect one tree in
a woodland, so it might give a narrow ring for a year when other trees just a little bit
further away have a wide ring.


teacher’s notes
student’s notes
sequence of climatic events – the records overlap in time
where the climatic patterns they record match up.
This allows dendroclimatologists to push back the year-to-
year
record of climatic conditions to long
before the start of instrumental recordkeeping.
Apparatus and materials
Pencil
3 paper strips representing cores taken from trees (see
Figure 1 and Figure 1 in the students’ material)
Pupil worksheets
Scissors
Ruler
Sticky tape
Coloured pencil
Cut cross-section of tree (ask local forest ranger) or a tree
stump outside
Tree rings: a climate record of the
past (teachers’ notes)
Level
This activity provides an example of one technique that
scientists use to study the way the Earth’s climate has changed
over time.
It works most effectively for 14-16 year-olds but with a little
simplification, or shortening, can work well with 12 and 13 year-
olds too.
Topic
Tree growth can be affected by climatic cycles and seasonal
cycles. The width of a tree ring shows the amount of growth
that has taken place during one year and thus indicates the
growing conditions for that year. When the conditions are good
the tree grows faster and so lays down more tissue in the year,
resulting in a wider growth ring. Poor conditions mean slower
growth, less tissue laid down and consequently a narrower ring.
Description
In this activity students learn about how tree rings provide a
record of past growing conditions and, by inference, climate.
They use this principle to work out how cores from three
different trees (three strips of paper marked with stripes to
represent rings) fit together to represent a longer period of time
and then use this composite record to plot a graph of changing
growing conditions / climate.
Context
Students doing this activity should already be familiar with the
processes of photosynthesis and the conditions necessary for
plant growth. They might have carried out experiments on
factors affecting the rate of photosynthesis / growth in previous
lessons (eg the concentration of carbon dioxide, temperature,
light availability). Most students will have seen the sawn-off end
of a tree trunk and attempted to work out the tree’s age by
counting the rings. But tree rings tell us much more than the
age of individual trees. They provide a year-by-year record of
changing climate that can be extended back over centuries,
reaching back beyond the beginning of the historical climatic
record. This makes them valuable tools (along with other proxy
records of past climate) for identifying whether current trends in
climatic change are within the natural, pre-industrial, range of
climate variability or outside it, and for dating past climatic
changes very precisely.
Teaching points
Tree rings form because during each growth season new water
and food conducting cells (tracheids) are added around the
perimeter of the tree trunk. Cells in the spring growth tend to be
larger with thinner walls than the previous set of cells produced
at the end of the previous summer. Over the course of the
growing season, successive rings of cells become smaller with
increasingly thick walls. In winter, growth ceases and no new
cells are laid down. Then when the new growing season
begins, thinwalled large cells form again producing a clear line
between the old wood and the new wood because of the
difference in texture.
Tree rings provide a record of past climate because their width
is determined by tree growth rate, which in turn is determined
by environmental conditions. Since one ring is produced every
year (usually) the ages of the climatic events can be worked out
very precisely by counting back. Records from young trees, old
trees, house and ship timbers and fossil trees can be tied
together by identifying sections with the same
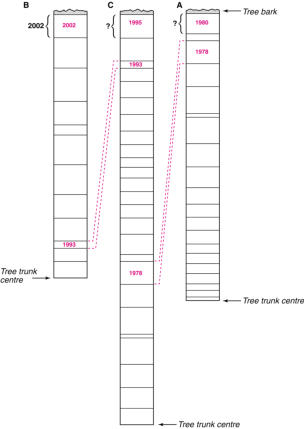
Figure 1 Simulated tree cores
Activity
Introduction
Hold up (or project on to wall) a picture of an old tree: this
tree could preserve a hundred years (possibly more) of
climatic history.


Ask students what affects the growth of a tree during a growing season. Here revise
factors affecting photosynthesis ie temperature, light, carbon dioxide concentration,
water availability.
Consider the growth rings on the tree cross-section, picture or stump outside. Ask
students how they think they form, what they represent, what they might be useful for
etc.
Explain that scientists (dendroclimatologists) can get a sample of the tree’s growth
rings by drilling a borehole into the tree (right to the middle) and extracting a core.
You could demonstrate the principle with an apple or a potato and a corer.
Main activity
This section gives the students the opportunity to sample the techniques involved in
reconstructing climatic history from tree rings.
Students work in groups using the pupil worksheet. The teacher should talk them
through it first.
Students are given a set of three prepared strips of paper – they represent cores
taken from three different trees (a living tree sampled in 2002, a fallen tree and a tree
used to build a log cabin) from the same woodland. Show how each rod or strip of
paper represents a core of wood taken from a tree trunk with one end representing
the centre of the tree and the other representing the bark on the outside. The
youngest wood is under the bark.
Using the simulated core samples, students can work out the age of each tree when
the core was taken (in the latter two cases, when the tree died) and record them in a
table like Table 1.
Tree sample Number of rings (= age in years)
A 20
B 12
C 25
Table 1 The ages of different trees
By looking at the ring patterns of the simulated cores, students can line up all three
samples to find how much time all three tree samples span together. They could
colour the overlapping sections so that they don’t lose track. The core samples were
taken from trees whose ages ‘overlap’. Given that the trees are of the same species
and all grew under similar conditions the tree-rings will therefore be the same
distance apart in the same year. With this information it is possible to match up the
rings as shown in red in Figure 1 and count the rings to give the two ‘unknown’
growth-years. The diagrams for each sample can be cut out and laid side by side to
see this more clearly.
Pupils should then measure the width of each tree ring, for each core sample, and
record them in a table such as Table 2. (Grey indicates sections where two strips
overlap.) There is no need to record the overlapping sections twice. Plot the ring-
width data (on the y-axis) against time (on the x-axis). They should plot 2002 on the
left (conventional for palaeoclimatic data). This will give a graph like Figure 2.


Tree ring width
0
5
10
15
20
25

Year


Figure 2 Graph of tree ring width against year
Year
Tree ring width / mm
2
0
0
2
14
2
0
0
1
18
2
0
0
0
20
1
9
9
9
14
1
9
9
8
6
1
9
9
7
18
1
9
9
6
18
1
9
9
5
14
1
9
9
4
14
1
9
9
3
4
1
9
9
2
8
1
9
9
1
10
1
9
9
0
10
1
9
8
9
10
1
9
8
8
8
1
9
8
7
8
1
9
8
6
6
1
9
8
5
6
1
9
8
4
8
1
9
8
3
8
1
9
8
2
8
1
9
8
1
10
1
9
8
0
12
1
9
7
9
4
1
9
7
8
14
1
9
7
7
14
1
9
7
6
16
1
9
7
5
2
1
9
7
4
16
1
9
7
3
14
1
9
7
2
12
1
9
7
1
10
1
9
7
0
8
1
9
6
9
8
1
9
6
8
8
1
9
6
7
6
1
9
6
6
6
1
9
6
5
6
1
9
6
4
6
1
9
6
3
4
1
9
6
2
4
1
9
6
1
2
Table 2 The widths of tree rings
Then they should consider these questions:
Q 1. Compare the ring for the year you were born with the ring for 2002. How do
they compare? Note down any similarities or differences. What might have
caused these?
Q 2. What does your graph of tree-ring width against time represent? = Growing
conditions: wider rings represent better growing conditions, ie warmer and
wetter. Narrower rings represent worse growing conditions, ie cooler and
drier. Hence, it provides a broad record of climatic conditions between 2002
and 1961.
Q 3. Give a brief and general description of how the climate changed during the
period that your tree samples represent.
Q 4. How could we obtain climatic information further back in time than tree rings
provide? = Ice cores can give climatic information back to over thousands of
years, sediment cores from the ocean bed can give climatic information over
millions of years, rocks give climatic information spanning hundreds of
millions of years.
Q 5. If carbon dioxide levels are rising and global warming continues, what
differences would you expect to see in the tree rings between the modern
ones and those laid down in 100 years time? = Future rings would be wider.
Conclusion
As a class, consider other factors that may have influenced growth. For example
fires, pollution, erosion, landslides. Also consider some of the problems with
matching up samples from different trees: certain factors influencing tree growth may
be very local in effect. A landslide or erosion for example might only affect one tree in
a woodland, so it might give a narrow ring for a year when other trees just a little bit
further away have a wide ring.

- Home
- contents
- help
- glossary
- Magnetic patterns 1
- Magnetic patterns 2
- Mantle convection
- Metamorphics
- Minerals & elements
- Plate riding
- Plate tectonic story
- Protecting the earth
- Rock cycle in lab
- Sedimentary rocks
- Separating mixtures
- Sequencing of rocks
- Solid mantle
- Structure of earth 1
- Structure of earth 2
- Structure of earth 3
- Tree rings
- Weathering
- Gravestones
- Lab volcano
- Investigate earth