


JESEI

teacher’s notes


Earthquake waves: the ‘find the earthquake’ team challenge
a) Locate an earthquake ‘team challenge’
Learning objectives:
that earthquakes produce longitudinal primary (P) waves and transverse secondary (S) waves; big earthquakes also produce surface waves
the worst surface damage is caused by surface waves, not by the P and S waves
waves travel at different speeds through the Earth; this can be used to locate an earthquake’s epicentre
development of team working skills
Timing: 30 minutes
Health and safety: risks none
Useful web links:
www.earthquakes.bgs.ac.uk (information on recent UK earthquakes)
www.sciencecourseware.com (virtual earthquake exercise)
Activity:
Provide for each team of 3 or 4:
Read-outs from three stations showing arrival of P and S waves and time differences (Figure 1); these read-outs are from seismograms
(printouts) produced by the three seismometers located at the positions shown in Figure 2.
A map of the region with scale shown (Figure 2).
A graph showing the relationship between P and S wave arrival times and distance to monitoring station (Figure 3).
A complete set of fact cards (below) containing all the information required to solve the problem – and some facts that are superfluous. Fact
cards have the following information:
* what a P wave and an S wave are (nature and name)
* what the waves do when an earthquake happens
* that P and S waves travel at different speeds
* what is the difference in speed
A pair of compasses.
‘Helpcards’ available with ‘clues’ if required. These contain more specific directions on how to proceed.
N.B. Fact Cards are to be copied, cut apart and allocated to team members. Help cards are only to be allocated if required.
Allocate one or two fact cards per person. Information has to be shared and discussed but, to foster team communication skills, team members
are not allowed to show each other their fact cards or to write down elsewhere what is written on each others’ fact cards. All members of the
team can look at the read outs from the three monitoring stations and the map of the region.
Teams have to devise a strategy to work out the location of the epicentre of the earthquake. The teams compete to be the first to solve the
problem and to find the correct location.
Outcome:
Teams work out that the time difference between the wave arrival times depends upon the distance of the monitoring station from the
epicentre. To locate the earthquake they draw circles of the appropriate (scaled) radius from the monitoring stations and locate the epicentre
where the three circles intersect.
Fact
P-waves are primary waves because
they arrive at monitoring stations first
Fact
S-waves are secondary waves because
they arrive at monitoring stations
second
Fact
The time difference between the arrival
of P-waves and S-waves depends upon
how far the monitoring station is from
the earthquake epicentre
Fact
P-waves are compression (longitudinal)
waves so they travel through the solid
parts of the Earth faster than S-waves
Fact
S-waves are shear waves so they
cannot travel through liquids. They
travel about half the speed of P-waves
Fact
If a P-wave arrives at a station 1.5
minutes before an S-wave then that
station is 900 km away from the
earthquake epicentre
Help card 1: circles drawn with their centres on each monitoring station will
intersect at the epicentre of the earthquake
Help card 2: radius of circle is found from the distance of the monitoring station
from the epicentre (drawn to scale).
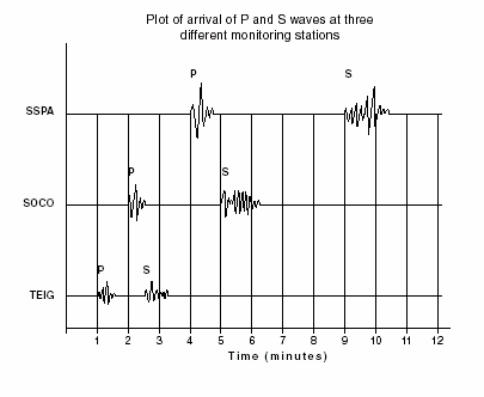
Figure 1
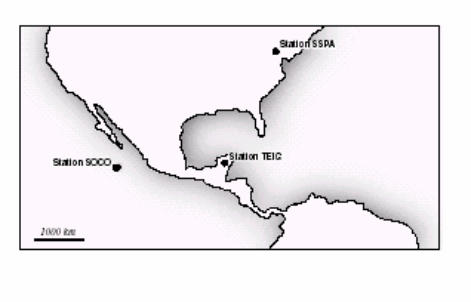
Figure 2


teacher’s notes
Earthquake waves: the ‘find the
earthquake’ team challenge
a) Locate an earthquake ‘team challenge’
Learning objectives:
that earthquakes produce longitudinal primary (P) waves and transverse
secondary (S) waves; big earthquakes also produce surface waves
the worst surface damage is caused by surface waves, not by the P and S
waves
waves travel at different speeds through the Earth; this can be used to locate
an earthquake’s epicentre
development of team working skills
Timing: 30 minutes
Health and safety: risks none
Useful web links:
www.earthquakes.bgs.ac.uk (information on recent UK earthquakes)
www.sciencecourseware.com (virtual earthquake exercise)
Activity:
Provide for each team of 3 or 4:
Read-outs from three stations showing arrival of P and S waves and time
differences (Figure 1); these read-outs are from seismograms (printouts)
produced by the three seismometers located at the positions shown in Figure 2.
A map of the region with scale shown (Figure 2).
A graph showing the relationship between P and S wave arrival times and
distance to monitoring station (Figure 3).
A complete set of fact cards (below) containing all the information required to
solve the problem – and some facts that are superfluous. Fact cards have the
following information:
* what a P wave and an S wave are (nature and name)
* what the waves do when an earthquake happens
* that P and S waves travel at different speeds
* what is the difference in speed
A pair of compasses.
‘Helpcards’ available with ‘clues’ if required. These contain more specific
directions on how to proceed.
N.B. Fact Cards are to be copied, cut apart and allocated to team members. Help
cards are only to be allocated if required.
Allocate one or two fact cards per person. Information has to be shared and
discussed but, to foster team communication skills, team members are not
allowed to show each other their fact cards or to write down elsewhere what is
written on each others’ fact cards. All members of the team can look at the read
outs from the three monitoring stations and the map of the region.
Teams have to devise a strategy to work out the location of the epicentre of the
earthquake. The teams compete to be the first to solve the problem and to find
the correct location.
Outcome:
Teams work out that the time difference between the wave arrival times depends
upon the distance of the monitoring station from the epicentre. To locate the
earthquake they draw circles of the appropriate (scaled) radius from the
monitoring stations and locate the epicentre where the three circles intersect.
Fact
P-waves are primary waves because
they arrive at monitoring stations
first
Fact
S-waves are secondary waves because
they arrive at monitoring stations
second
Fact
The time difference between the arrival
of P-waves and S-waves depends upon
how far the monitoring station is from
the earthquake epicentre
Fact
P-waves are compression
(longitudinal) waves so they travel
through the solid parts of the Earth
faster than S-waves
Fact
S-waves are shear waves so they
cannot travel through liquids. They
travel about half the speed of P-
waves
Fact
If a P-wave arrives at a station 1.5
minutes before an S-wave then that
station is 900 km away from the
earthquake epicentre
Help card 1: circles drawn with their centres on each monitoring station will
intersect at the epicentre of the earthquake
Help card 2: radius of circle is found from the distance of the monitoring station
from the epicentre (drawn to scale).

Figure 1
Figure 2

- Home
- contents
- help
- glossary
- Magnetic patterns 1
- Magnetic patterns 2
- Mantle convection
- Metamorphics
- Minerals & elements
- Plate riding
- Plate tectonic story
- Protecting the earth
- Rock cycle in lab
- Sedimentary rocks
- Separating mixtures
- Sequencing of rocks
- Solid mantle
- Structure of earth 1
- Structure of earth 2
- Structure of earth 3
- Tree rings
- Weathering
- Gravestones
- Lab volcano
- Investigate earth